

Your paid social performance was great two weeks ago, but has recently started to tank. Here’s how to quickly identify the issue(s) and get back on track as soon as possible:
1. Technical issues related to your tracking or website: sometimes, it’s not a media problem but a tracking/website problem. To identify issues that might be tracking specific, start by testing your ad platform pixels via the appropriate pixel helper browser extension, to ensure they’re firing appropriately.
From here, look at key metrics related to your website funnel. Has your landing page conversion rate percentage changed significantly? Have you seen a significant drop off in conversion rate at a specific point in your buy flow such as checkout?
Quite often a website change with the best intentions can be the culprit. For example, those new beautiful (but heavily weighted images) sitting on your homepage might have slowed down your site load speed – therefore causing an increase in bounce rate. Use a tool like Google page speed insights or Pingdom to help diagnose this.
Overall, a quick identification of the problem area can often be achieved by comparing key metrics across the period where you’re having poor performance, versus historical norms.
2. Creative/audience fatigue: use the compare feature in ads manager/a quick line graph to evaluate your CTR over time – a downward trend means you likely need to refresh your content. Stay ahead of this issue by constantly testing new hooks/angles of creative, even when performance is great. In addition, check your frequency at the account/campaign/ad set level – anything above 2 per week is likely too much weighting. To solve, consider adjusting budgets down and/or broadening/consolidating audiences which have overlap.

3. Performance trends: look at your performance by day of the week historically. Are Monday’s always bottom performing days, whereas Wednesday’s crush it every week? Seeing poor performance at the end of the month/quarter/fiscal year? You’re likely being impacted by auction dynamics – where advertisers are bidding/spending aggressively on the premise of hitting performance targets, or Fortune 500 advertisers are dumping marketing dollars into the platform under a “use it or lose it” mandate. Also look at the calendar to identify key national holidays/celebrations as they can often cause shifts in consumer behavior/spending. E.g. don’t be surprised to be drowned out by surrounding promotional messaging when it comes valentines day if your product isn’t giftable.
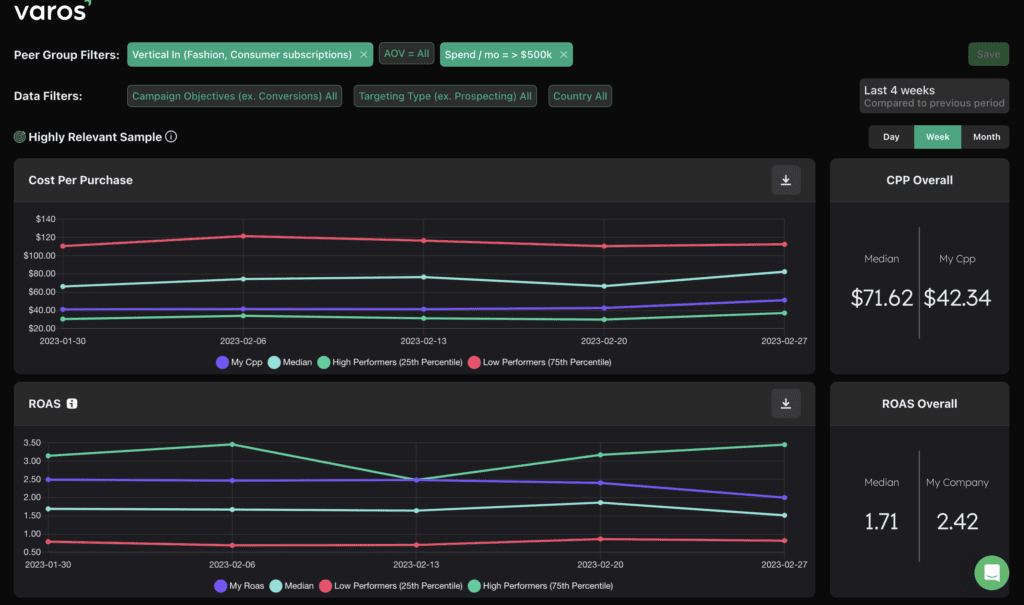
Beyond the above and in more recent years, we’ve found advertising benchmarking tool Varos to be incredibly helpful for contextualizing advertisers’ performance amongst industry peers. With this you can compare KPIs anonymously and securely with companies in the same vertical and spend level as yours – this helps answer the question “is it just me, or everyone else too?”